|
OWL
Dayton PA200 8″ Woofer with Selenium ST200 Super Tweeter
The OWL is a passive PA speaker using a Dayton 8″ PA200-8 Pro Woofer with a Selenium ST200 Super Tweeter. I will start off by tackling the ST200 first. This is the most critical part of the speaker. If it doesn’t pass this stage, there’s no point going further.
Selenium ST200 Frequency Response
Fig 1 – Black plot = RAW. Red plot = 4K (18dB/oct). Blue plot = 4K Active (18dB/oct)
The Black plot in Fig 1 is the RAW response of the ST200. This is without any crossover. The Red plot is with a 3rd order passive high pass filter with fc=4kHz. The Blue plot is active with the Synergy crossover at 4kHz (18dB/oct). All plots are normalized.
The passive crossover response is very similar to the active one. From 20kHz ~4kHz, they are exactly the same. The difference is below 4kHz. The passive crossover (Red plot) doesn’t roll-off as steeply as the active Blue plot.
To get the Red plot to overlap the Blue plot below 4kHz, I will need to install a conjugate (LCR) network. That will obviously increase the crossover cost which I want to avoid. If I’m using a $100 tweeter, it’s not a problem but the ST200 is only about $20. It’ absurd that crossover parts cost more than the drivers. I will work without the conjugate network for the time being. If I can get away with it, so much the better.
Toneburst Energy Storage
 Fig 2 – Selenium ST200 at 4kHz (18dB/oct) passive high pass filter Fig 2 – Selenium ST200 at 4kHz (18dB/oct) passive high pass filter
The light blue slices in Fig 2 are stored energy of the ST200. I’m not concerned with the ones above 10kHz because the ST200 is already rolling off. What we are seeing there are probably the diaphragm ringing. It is at the crossover region, 4kHz~5kHz that I’m more concerned about. There are a few light blue slices but they are so minor they will not cause any smearing.
Spectrogram
 Fig 3 – Selenium ST200 at 4kHz (18dB/oct) passive high pass filter Fig 3 – Selenium ST200 at 4kHz (18dB/oct) passive high pass filter
As I had expected, the Spectrogram in Fig 3 shows the stored energy is already -30dB below the fundamental at 4ms. At 5kHz upwards, there’s virtually no artifacts. From these plots, they indicate the ST200 is super clear.
Harmonic Distortion
 Fig 4 – Red plot = 2nd harmonic. Violet plot = 3rd harmonic Fig 4 – Red plot = 2nd harmonic. Violet plot = 3rd harmonic
Fig 4 shows the 2nd and 3rd harmonics of the ST200 with a 4kHz, 18dB/oct passive high pass filter. Distortion is about -50dB below the fundamental. No anomaly observed.
Now that I’m confident the ST200 has no issues with a passive filter, it’s time to marry it with the Dayton PA200 woofer.
Dayton PA200 and Selenium ST200 Frequency Response
 Fig 5 – Blue plot = PA200. Red plot = ST200 Fig 5 – Blue plot = PA200. Red plot = ST200
The Blue plot in Fig 5 is the Dayton PA200 with a 4kHz, 18dB/oct low pass filter. From here, we can see we are right before the cone breakup. This is the limit of the PA200. All measurements below 500Hz are in Nearfield.
The Red plot is the ST200 with a 4kHz, 18dB/oct high pass filter. Acoustically, the two drivers are crossing at 4kHz. So far, they look promising.
OWL Frequency Response
Fig 6 – Summed Response of PA200 with ST200
Fig 6 is the summed response of the PA200 with the ST200. The two drivers sum very well. There is a slight hump at 3~4kHz. I can lower it by installing an LCR for the tweeter but it’s not worth the extra cost if this hump is benign. Furthermore, it’s nothing an EQ cannot handle. After all, EQs are commonly used in PA. The question is whether this hump is audible in use.
OWL Cumulative Spectral Decay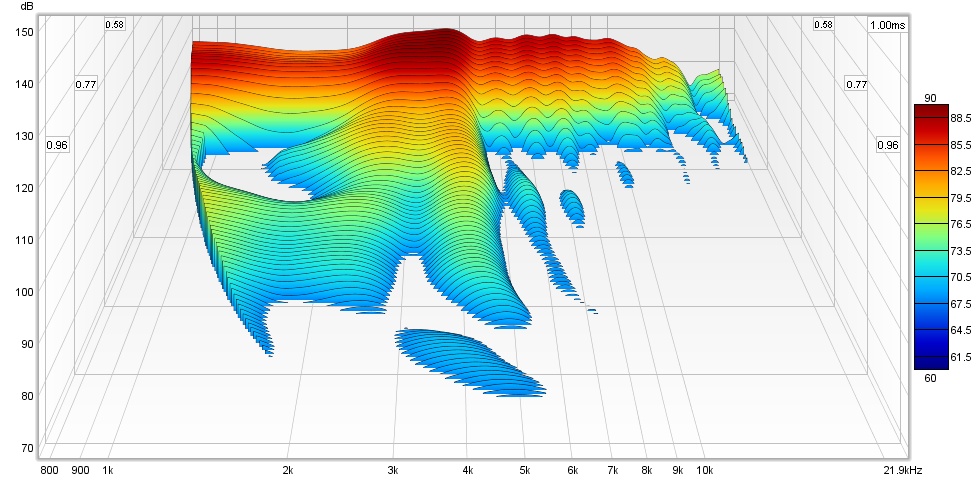
Fig 7 – REW Waterfall. Rise Time = 0.10 msec. Window = 1.3 msec ( 769Hz ). Time Range = 1.0 msec
Fig 7 is the Waterfall plot of the OWL. There are very little artifacts above 5kHz. Below that, the decay is longer but still less than 1ms.
OWL Toneburst Energy Storage
Fig 8 – TES of OWL. Passive crossover at 4kHz (18dB/oct) HPF and LPF
The Toneburst Energy Storage plot in Fig 8 shows there’s some stored energy (light blue slices) at the crossover region. They don’t last very long, only 6 cycles.
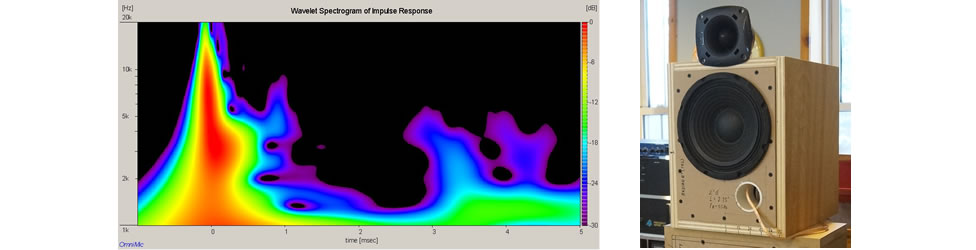
OWL Spectrogram
Fig 9 – Spectrogram of OWL. Passive crossover at 4kHz (18dB/oct) HPF and LPF
The Spectrogram in Fig 9 shows the decay (time) vs the frequency (kHz) of the OWL. At 4kHz, the Violet patches (-30dB) is less than 5ms. As we move down towards 1kHz, we can see the decay getting stronger (Green patches). That’s because it’s the Dayton PA200.
the OWL in use
There is virtually no difference between the passive OWL and the active version. Both sound the same. I couldn’t make out any difference.
For PA use, the OWL is outstanding. Where it shines is in the voices. It’s clear, not blur and muffled. It is great for announcements in schools or as a dedicated speaker for the vocalist in a band.
The OWL is so good that I can even recommend it for HiFi or Home Theater. Bass is there but not as deep as in a 3 way with a 10″ or 12″ woofer. If deep bass is desired, add the Albatross or the Toucan and it’ll be music made in heaven.
Note: All measurements were made with the mic at 1m, tweeter axis. Impulse Window=5ms. No smoothing applied.
|
 Mark Rosado