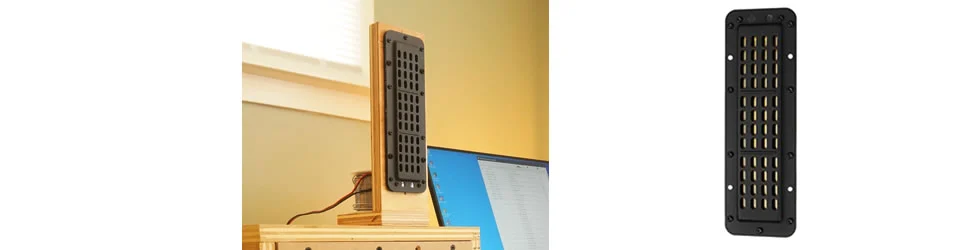
GRS PT6816-8 Dipole Planar Tweeter
For this review, the PT6816 is mounted in dipole fashion. In dipoles, the rear of the tweeter is “open” back”, that is it is not enclosed. Sound radiates from the front as per normal but it also radiates from the back. The front sound is in-phase whereas the rear is out of phase. There are advantages and disadvantages in using dipoles but I will leave that for another day. The main reason I’m using a dipole to test this tweeter is simply because it’s the fastest and most convenient way. If it doesn’t work out, I will resort to a rear chamber.
Fig 1 is the RAW frequency response of the dipole PT6816. For this measurement, the bass is removed from the test sweep. This is important otherwise the tweeter will be damaged as no capacitors are used. From the plot, we can see the tweeter goes as low as 400Hz, after which she dies off quite rapidly. To protect the tweeter, I’m inclined to cross her at 700Hz. At this frequency, the tweeter will be more robust. Furthermore, I will avoid the notch at 500Hz.
Fig 2 is the plot with my active crossover set at 700Hz (24dB/oct). Just as I had hoped, the roll-off is smoother. This is something I can live with.
I like to use the Toneburst plot because it offers me a quick analysis of the artifacts. The PT6816 is surprisingly free of artifacts (Fig 3) till about 10kHz where she experienced a burst of energy. Frankly, I’m not concerned with what happens at 10kHz. I will deal with it if necessary. It is the lower treble that interests me. From 1kHz~5kHz, there are no artifacts. Incredible.
Fig 4 is the Waterfall plot of this planar tweeter. All the artifacts are concentrated at 10kHz. Even then, they will not interfere with the music as they dissipate very quickly.
The Wavelet in Fig 5 is something I’ve never seen before. There is a similar pattern of the main wavelet at 6kHz. Though the intensity is less, it looks exactly the same.
I thought perhaps OmniMic was recording a false plot. I switched over to REW (Fig 6) and the result is the same. At 6ms, a plot is recorded that looks similar to the main spectrogram. It took me a few days to digest the meaning of these Wavelet and Spectrogram. It then occurred to me that the secondary plot is a reflection of the sweep from the back wall. Don’t forget, this is a dipole. The sweep is also emitting from the rear of the planar. Summary So far, the measurements are pretty impressive. The next step is to marry the PT6816 with a woofer to ascertain how she performs in a typical 2-way. More to come. Unless otherwise stated, all measurements were made in Full Space (4pi). Mic at 36 ins, tweeter axis. Impulse Window=5ms. No smoothing applied. |
June 3, 2025Drivers Evaluation, HIFI DRIVERS
 Fig 1 – GRS PT6816-8 RAW Frequency Response (Dipole)
 Fig 2 – GRS PT6816 crossed at 700Hz High Pass (24dB/oct)
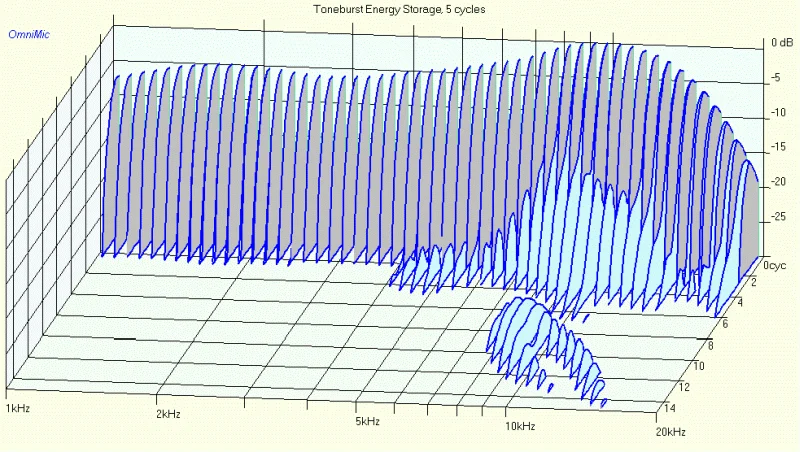 Fig 3 – GRS PT6816 Toneburst Energy Storage
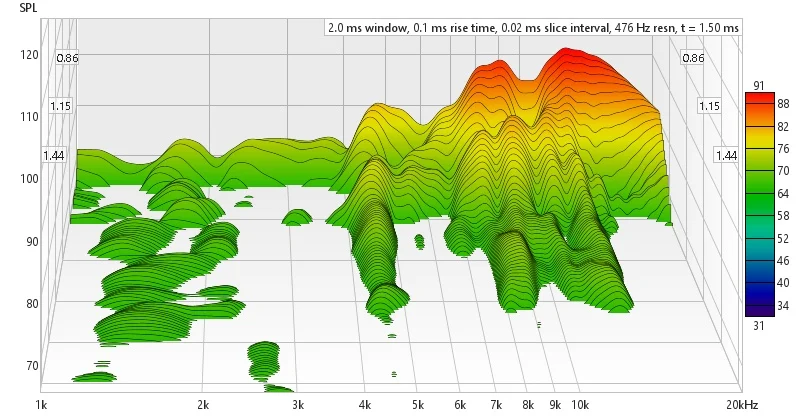 Fig 4 – GRS PT6816 Waterfall
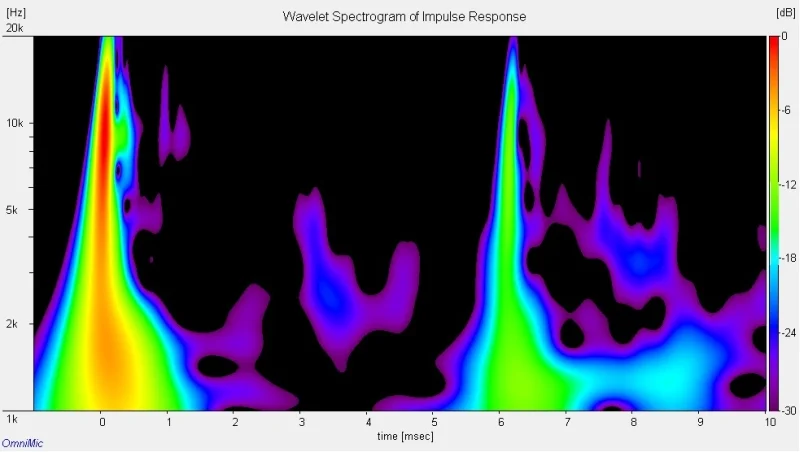 Fig 5 – GRS PT6816 Wavelet
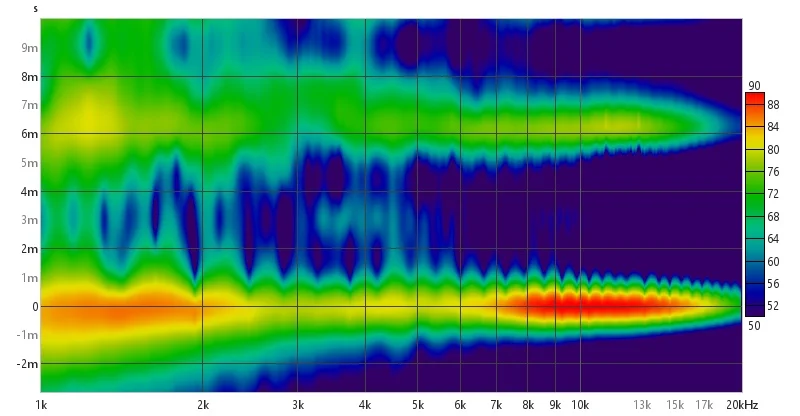 Fig 6 – GRS PT6816 Spectrogram